Statistics Calculators

Published: 15 November 2026 · Updated: 15 November 2026
Statistics calculators turn lists of numbers into summaries — centre, spread, and the line that best fits paired data. The free tools below cover descriptive statistics and least-squares regression with both sample and population standard deviations shown and labelled, so the choice is always deliberate.
Paste data, read the story. Mean, median, quartiles and both standard deviations for one list; slope, intercept, correlation and predictions for paired lists. Check the sorted-data line for typos before you trust any summary.
Researched by MixKhazana Team · Last updated 15 November 2026 · Data: OpenStax Statistics §12.2; OpenStax Introductory Business Statistics §2.7
What is a statistics calculator?
A statistics calculator summarises data: the centre of a data set (mean, median, mode), its spread (range, quartiles, standard deviation), and — for paired measurements — the straight line that best fits the cloud of points. Statistics courses expect students to compute small examples by hand once, then use a calculator for real data, where hand calculation is slow and error-prone. The College Board expects a graphing calculator with statistical capabilities for AP Statistics, and notes that from the 2027 exams nongraphing calculators are not allowed for that subject even with statistical functions — a sign of how central the statistical toolset has become.
The most important distinction in the subject is also the easiest to get wrong: sample versus population. The formulas look identical except for one denominator — n − 1 for a sample, N for a population — and textbooks stress it because it changes every standard deviation you report. The free tool shows both, labelled, so the choice is deliberate rather than accidental.
Tools in this category

Free Statistics Calculator
Descriptive statistics plus least-squares regression, correlation and predictions. The main tool of this category.
Open →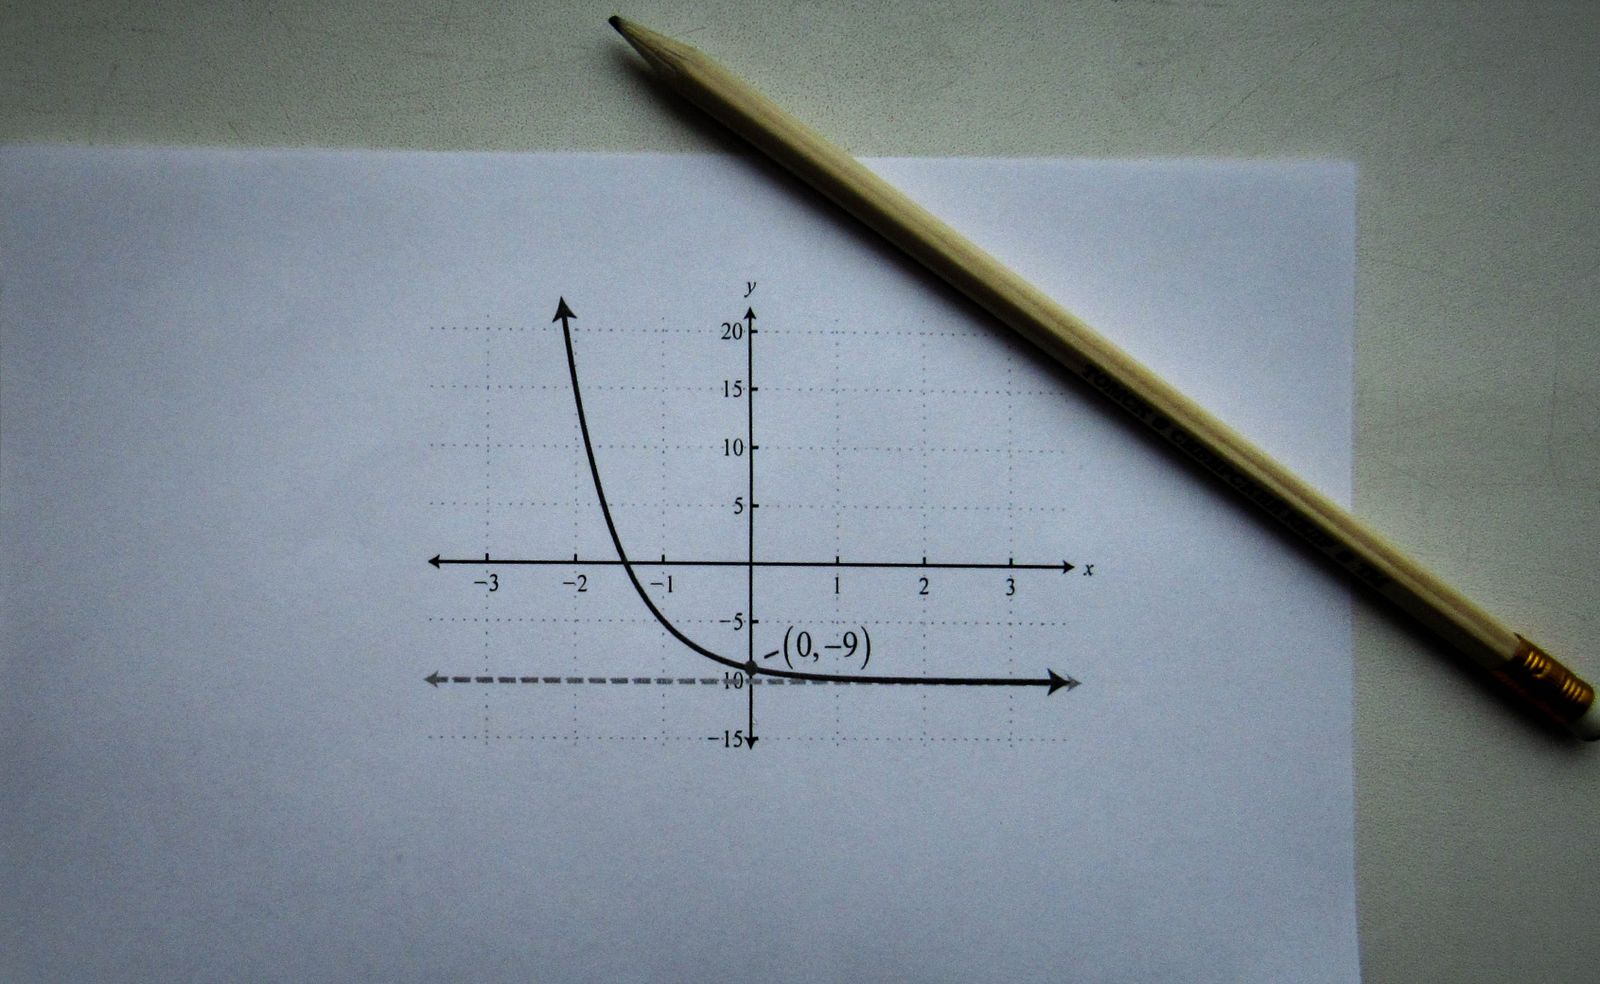
Free Graphing Calculator
Plot regression lines and data patterns; see the line your statistics describe.
Open →
Free Percentage Calculator
Percentages, increases and decreases — the arithmetic behind relative frequencies and rates.
Open →Card photos: Lukas Blazek / Pexels, Pexels licence · Sergey Meshkov / Pexels, Pexels licence · Coyau / Wikimedia Commons, CC BY-SA 3.0
The statistics toolkit, piece by piece
| Measure | What it answers |
| Mean, median, mode | Where is the centre of the data? |
| Range, IQR | How wide is the spread, including and excluding extremes? |
| Standard deviation | How far do typical values sit from the mean? |
| Regression line ŷ = a + bx | What straight line best predicts y from x? |
| Correlation r, r² | How strong is the straight-line relationship, and how much variation does it explain? |
Reading regression output without fooling yourself
Three cautions belong with every regression. First, the line always passes through the point of means (x̄, ȳ) — a useful check on your arithmetic. Second, predictions outside the observed x range are extrapolations: the straight-line pattern may not continue, and the further out you go, the weaker the warrant. Third, correlation is not causation: a strong r between two variables never, by itself, shows that one causes the other. The free statistics tool reports the slope, intercept, r, r² and a prediction together, so all three cautions can be applied to the same output.
Quartiles: why textbooks disagree slightly
There is no single universal quartile rule: textbooks differ in how they interpolate between sorted values, so Q1 and IQR can differ slightly between methods on the same data. The free tool uses linear interpolation — the common spreadsheet percentile method — and says so on the page. If your answer differs from a textbook's by a small amount on quartiles alone, the method is almost certainly the reason, not an error.
Frequently asked questions
What does a statistics calculator compute?
Descriptive summaries — mean, median, mode, quartiles, range and standard deviation — and, for paired data, the least-squares regression line with correlation and predictions.
Sample or population standard deviation — which do I use?
Use the sample version (divide by n - 1) when your data are a sample from a larger group, which is the usual class case. Use the population version (divide by N) only when you have measured every member of the group.
What is the least-squares regression line?
The line y-hat = a + bx that minimises the sum of squared vertical distances from the data points to the line. Its slope is b = sum((x - x-bar)(y - y-bar)) / sum((x - x-bar) squared) and its intercept is a = y-bar - b times x-bar.
What does r-squared mean?
r-squared is the share of the variation in y explained by the regression line: 0.6 means 60%. The rest is variation the straight line does not capture.
Can I paste spreadsheet data into the statistics tool?
Yes. Copy a column and paste it in: values separated by commas, spaces, new lines or semicolons are all accepted, and the sorted-data line lets you spot a mistyped value at once.
Why do quartile answers differ between textbooks?
Because quartile rules differ: some methods interpolate, others take medians of halves. The tool uses linear interpolation and states it, so small differences from another method are expected, not errors.
Does a strong correlation prove one thing causes another?
No. Correlation measures straight-line association only. Causation needs a designed study or a causal argument; a high r alone proves nothing about cause.
What calculator does AP Statistics expect?
A graphing calculator with statistical capabilities. From the 2027 exams, nongraphing calculators are not allowed for AP Statistics even with statistical functions, per the College Board policy.
Sources
- OpenStax, Introductory Business Statistics §2.7, Measures of the Spread of the Data — sample and population variance and standard deviation.
- OpenStax, Statistics §12.2, The Regression Equation — the least-squares line and interpretation of slope.
- College Board, AP Exams Calculator Policy — AP Statistics expectations, including the 2027 update.
Disclaimer: a study guide. The linked tools are homework and revision aids, not approved exam-room devices; check your exam board's calculator policy before exam day.